Chart of the Day: Tracking the Geography of Job Growth
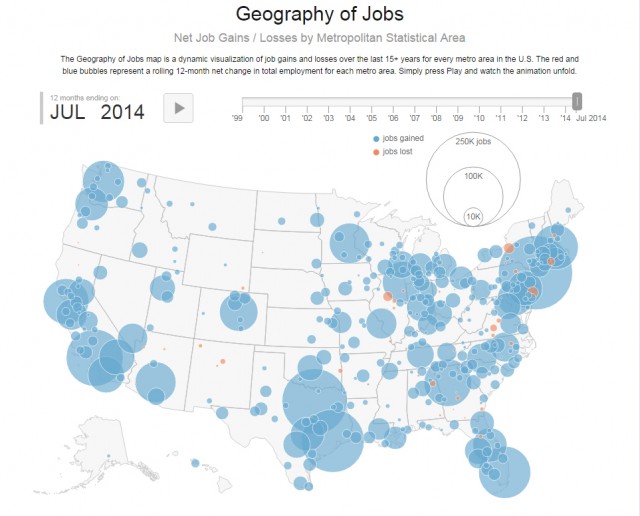
TIP Strategies, the economic development consultant firm based out of Austin, Texas who partnered with Chester County to create VISTA 2025, the 10 year economic strategic plan rolled out earlier today, updated their interactive graph that tracks job creation by metropolitan area to reflect employment numbers from 2000 through July 2014.
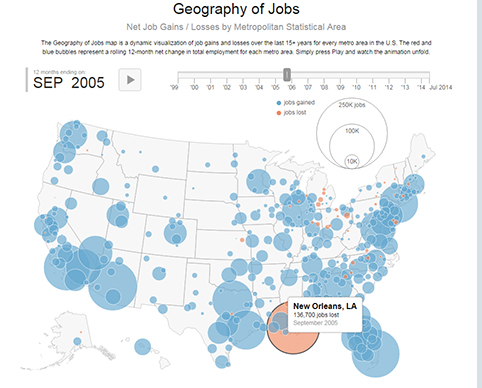
The graph allows users to examine job growth over the past fifteen years anywhere in the United States. You can watch as the housing crises begins to disrupt job creation via Florida and California in 2007 as well as the devastating jobs loss (136,700) as a result of hurricane Katrina in the Fall of 2005 (right).
Tip Strategies partners with hundreds of communities across the country to create invaluable road maps for economic success based on hard data and smart analysis, including our very own CCEDC.
You can view the interactive chart here.
Connect With Your Community
Subscribe to stay informed!
"*" indicates required fields


")